
The data presented in this post and captured in all our U.S. Workforce Activity Reports is courtesy of Dave Gilbertson, VP of Strategic Planning and Operations for Workforce Ready.
One of the most fundamental ways to engage with your workforce is through time punches, because punching in and out directly relates to employees’ paychecks. In this new normal, it is critical to ensure employees have a safe way to punch in and out, that they can choose from different pay methods such as direct deposit or pay cards, and that mobile access is available for employees working both on site and remotely. These are small yet impactful ways to enhance your employee experience.
While punch data is an essential engagement tool for your organization, did you know the same data can predict an economic recovery? At Kronos and Ultimate, we have the unique ability to analyze U.S. workforce activity through shift punches. We are currently analyzing over 30,000 U.S. businesses and their 3.2 million employees to see the impact of COVID-19 and compile activity reports. These reports have given us insight into how the workforce is recovering. And good news — it is recovering. Below is a summary of the data we’ve collected as of June 21, 2020.
For an in-depth analysis of the activity report, click here.
Has the worst passed?
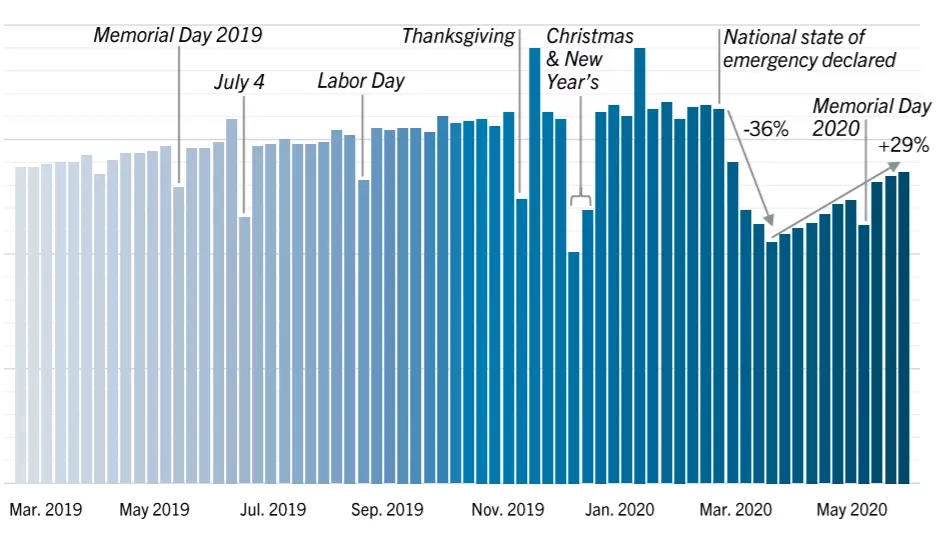
According to the latest activity report, the worst of the pandemic may be behind us. Based on data collected over the past 15 months, the U.S. workforce seemed to have hit its lowest point for shift punches (which we refer to as the bottom) around April 12, 2020. From the time the national state of emergency was declared on March 15, 2020 to April 12, 2020 shift punches rapidly declined, with a 36% decrease in shifts.
While many shifts were lost during this time, by June 2, 2020, businesses had recovered over half of them. In fact, between April 12, 2020 and June 21, 2020, shift punches increased 29%. There was a slight decline in shift punches the week of Memorial Day, with an 8.8% decrease; however, it mirrors that of a 12.3% decrease in shifts the week of Memorial Day 2019.
Shifts worked across the country over the past 15 months
States and shift punches
Now, let’s get into more specifics. We can break our data down to look at each individual state, allowing us to see which states are beginning to recover and which are still struggling.
As of June 21, 2020:
- 10 states saw shifts decline*
- 26 states have seen COVID-19 cases rise since early June*
- 3 states’ workforces are within 3% of pre-pandemic levels
- Alaska
- New Hampshire
- Washington
Between March 15, 2020 and June 14, 2020:
- Rhode Island had the largest shift decline with a 57% decrease in shifts worked
- New Hampshire had the smallest shift decline with a 0.5% decrease in shifts worked
*States are listed in the latest report on our U.S. Workforce Activity page.
Industries and shift punches
The activity report also offers a view of how industries with a heavy reliance on an hourly workforce are being impacted. The industries focused on in these reports are healthcare, manufacturing, retail and hospitality, service sector, and public sector.
Per the report, industry data can be broken up into two phases — the industry’s peak decline and the percentage of shifts it’s recovered. Breaking it up into two phases helps give us a better understanding of which industries are on the road to recovery.
| Industry | Peak Decline | Recovered |
|---|---|---|
| Healthcare | -19% | 56% |
| Manufacturing | -34% | 57% |
| Retail and Hospitality | -37% | 48% |
| Service Sector | -38% | 52% |
| Public Sector | -56% | 37% |
| Total | -35% | 53% |
So, what does all this data mean? The U.S. workforce is recovering. For more in-depth information, please read the full activity report on our Workforce Activity Report page. On that page, you will find activity reports going all the way back to the week of April 13, 2020.
Interested to see what else we track in our Workforce Activity reports and why we chose to track it? Make sure to check out this post from our What Works blog: Workforce activity and economic health: Insights on COVID-19’s impact.