
This blog is part of a miniseries on UKG Dimensions™ Data Hub. To go to the start of the series, visit our first blog here
In this continuation of the Data Hub series, we’ll get hands on with the platform. I’ll talk about operational challenges a customer was experiencing, and how Data Hub helped them tackle these challenges. After I talk about the background of these challenges, I’ll explain the process the team used to extract and analyze the data.
The early adopter customer who we’re going to talk about would like to stay anonymous, so let’s call them by the alias Green Gables instead. Green Gables is a non-acute healthcare customer with housing and programs where they help take care of people. They’re one of the most compassionate organizations that we’re proud to call a customer of UKG™ (Ultimate Kronos Group). And as every reader today can imagine, in March of 2020, they found themselves amidst a global pandemic that was affecting their industry in the most unexpected and difficult of ways.
A people-first mindset
Green Gables made many changes to support their people, both for the caregivers and care recipients. One change the organization made was to adjust the punch rounding rules for a set of employees in a way that paid employees to at least a full 8-hour day of work. While working hours become chaotic and less certain, or when employees were asked to come in late or leave early, the rounding rules helped keep employee compensation stable. This ensured employees’ paycheck had some form of stability in an otherwise remarkable, uncertain time.
This change was made early in the era of COVID-19, and it was a clever and agile solution to adjusting how employees are paid without upending entire systems of payrules and accruals. The drawback was it added a confounding factor to Green Gables’ existing HR analytics and reporting. In these existing reports, used to understand hours worked, managers found it difficult to distinguish worked hours from the rounded-to-schedule hours. As any reader of this blog can imagine, it’s still important to understand the actual hours worked by your workforce, even if you are paying them more than that. Managing worker fatigue and total hours for compliance reasons comes to mind as a good reason to want to track this.
Let’s look next at how the early adopter was able to stratify this data to understand the actual work from the rounded values.
UKG Dimensions helps your frontline
The good news for Green Gables is that UKG Dimensions Analytics comes out of the box with a KPI designed to view time-work-not-paid and time-paid-not-worked. Here’s what this might look like in one of the UKG Dimensions Dataviews:
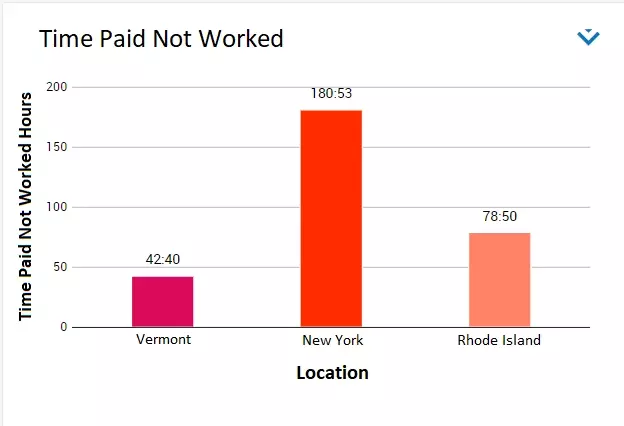
These KPIs and their related Dataviews allowed frontline managers at Green Gables to gain daily insight into their people, enabled operational management of the effects of the rule change and the actual work being performed.
Big data? Try Data Hub
Leadership was still interested in a long-term look at this data. When it comes to analyzing historical workforce or human capital data, Data Hub is a great tool for this job. Data Hub brings detailed data from UKG Dimensions into Google Big Query. The pre- and post- punch round times are all available for every punch, alongside people information, so we can filter the search down just for the subset of employees that were affected. Lastly, we have the business structures so that we can aggregate and drill down in the data.
This data, in Data Hub, is available for long historical periods (years in many cases), and in this example stretched back to pre-COVID, so that Green Gables can look at the timecards over the entire period. And with the data now in front of you, in a clean and rectangular format, you can continue your analysis with Big Query Aggregate Functions.
If you’d like to try this for yourself on your own Data Hub tenant, I’ve uploaded the query source code to Gist that anyone is free to download.
What’s next?
Data Hub gave Green Gables the analytics it needed to untangle its employee pay from its employee hours worked that stemmed from a rapid pivot due to COVID-19. This allowed the organization to manage employee burnout at the same time as understanding its total payroll. Long term, there are other ways to manage this configuration change, but global pandemics don’t always wait for you to consider the downstream reporting effects of making a rule change to your workforce.
To wrap things up, the Dataviews and KPIs you’re already familiar with are the best instrument for managing your day-to-day people pay and data-driven decision making, especially if you are a frontline manager. Data Hub is the tool you pick-up when you need to analyze trends and explore data that might span years or your entire organization. Or if you need to apply more sophisticated analysis.
Learn more about Data Hub and talk your customer success or account manager to learn which part of the UKG Dimensions toolbox is right for the task you have at hand.


